
Social media data visualisation
I create data visualisation content that transforms complex insights into clear, engaging visuals for social media, reports, and client communications.
Translating data into storytelling
I specialise in turning both quantitative and qualitative insights into digestible, visually engaging content. Whether for social media or more formal outputs, my focus is on clarity, narrative, and audience relevance.
Using tools such as Canva and Adobe InDesign, I design content that balances data with strong visual hierarchy, ensuring key messages stand out while maintaining brand consistency and readability.
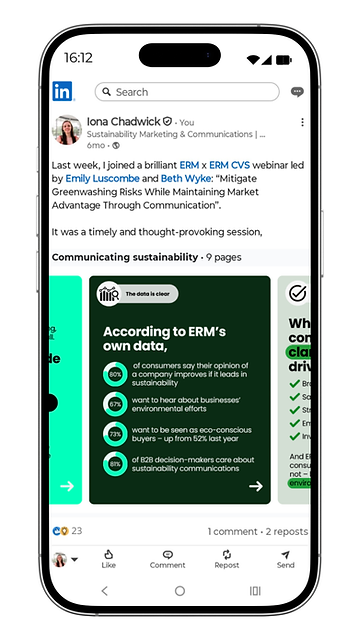
Example: webinar insights (LinkedIn content)
As an example, the image on the right showcases a LinkedIn carousel post I created summarising key takeaways from a sustainability communications-focused webinar. I distilled a large volume of information into concise, impactful visuals, combining data points with clear messaging to make the insights accessible and engaging for a professional audience. Click here to see the full carousel on LinkedIn.
.png)
This approach helps transform complex information into content that is easy to understand, visually compelling, and optimised for audience engagement across platforms.

_edited_edit.jpg)
